SC Sage
Ferrari – Lamborghini – McLaren – Porsche
Real Market Data, Analytics, Price Charts and Vehicle Valuations
We Apply Robust Statistics and Advanced Modeling Concepts to Extract Operable Data – Like No Other Source Our Proprietary Quantitative Market Analytics Use Daily Market Inventories to Discover, Interpret and Share New Insights and Knowledge in the Supercar Space – Nothing Compares to SC Sage
SC Sage Quick Take Video
SC Sage Apps/Charts Video
Core Sage Apps Video
CLICK TO GET SC SAGE MARKET VALUE DATA BY VIN FOR UNLIMITED VINS
Rank And Range Apps A La Carte
Sage Price App A La Carte
Sage Revaluation App A La Carte
Sage Apps A La Carte Suite
VEHICLE Market POSITION





Sage Price App
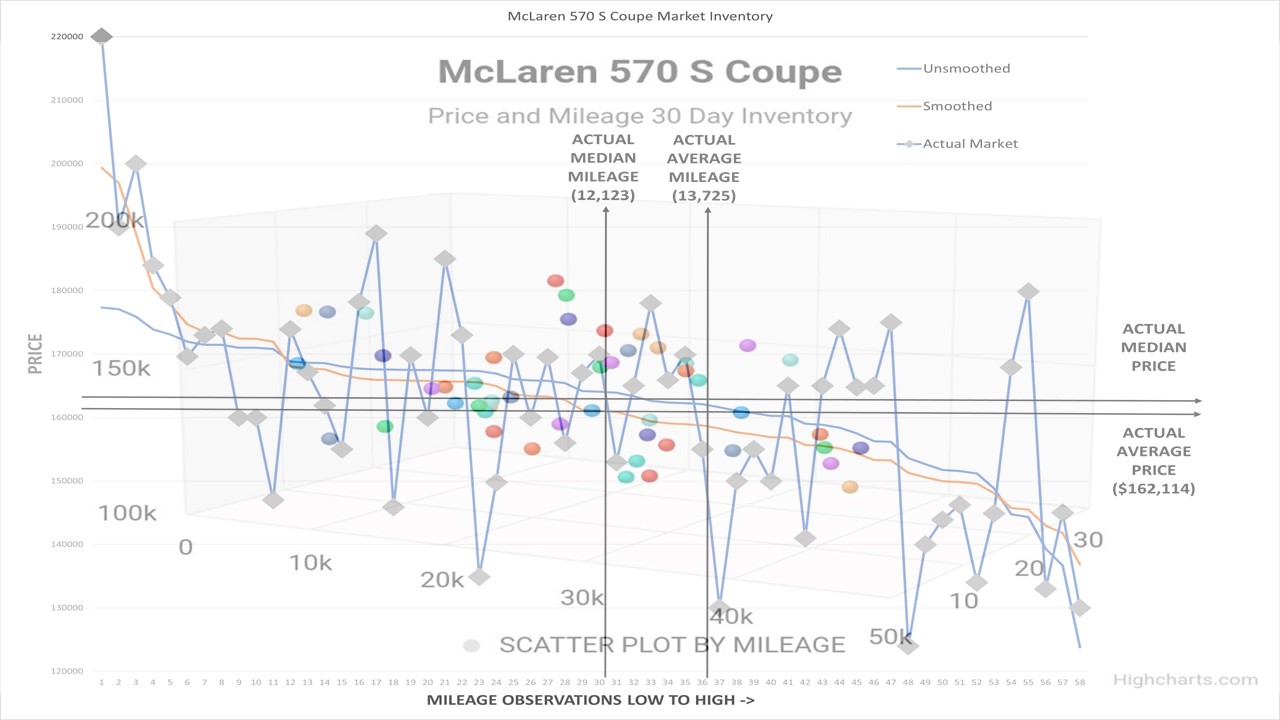
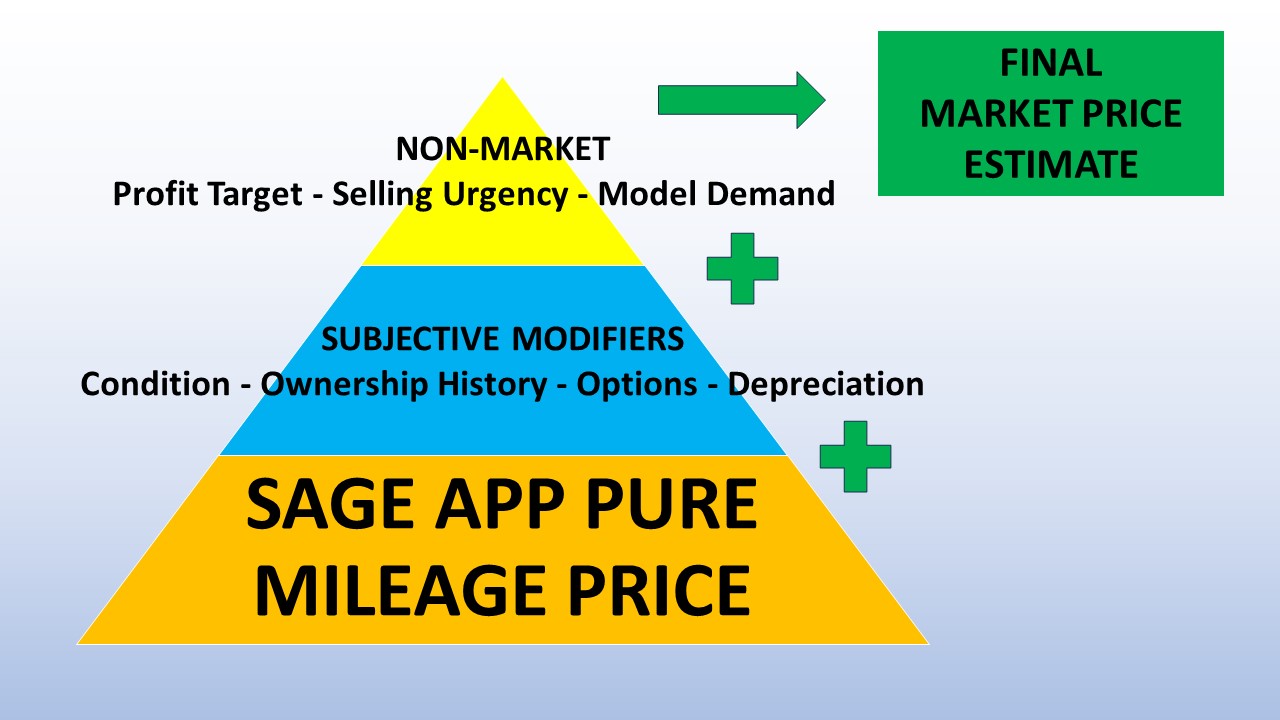
- The Sage Price app uses median mileage metrics to in two distinct pricing models to determine the ‘pure mileage’ based value of a vehicle given its mileage.
- The ‘Zero Rank’ model calculates a price using only the market inventory of vehicles which fit in the same distribution range of mileage as the subject vehicle. Using this data range, the vehicle’s mileage and 0 Rank logic it derives a price.
- The ‘Linear’ model uses all of the price and mileage pairs in the market inventory to extract a price by applying a ‘best fit’ linear regression model. Three different statistical models are evaluated and the best fit is selected.
- The models extrapolate the unexplained difference between the pure mileage based price and a submitted price.
- Included with Premium Plus and Premium Pro Subscription.
Sage Rank App
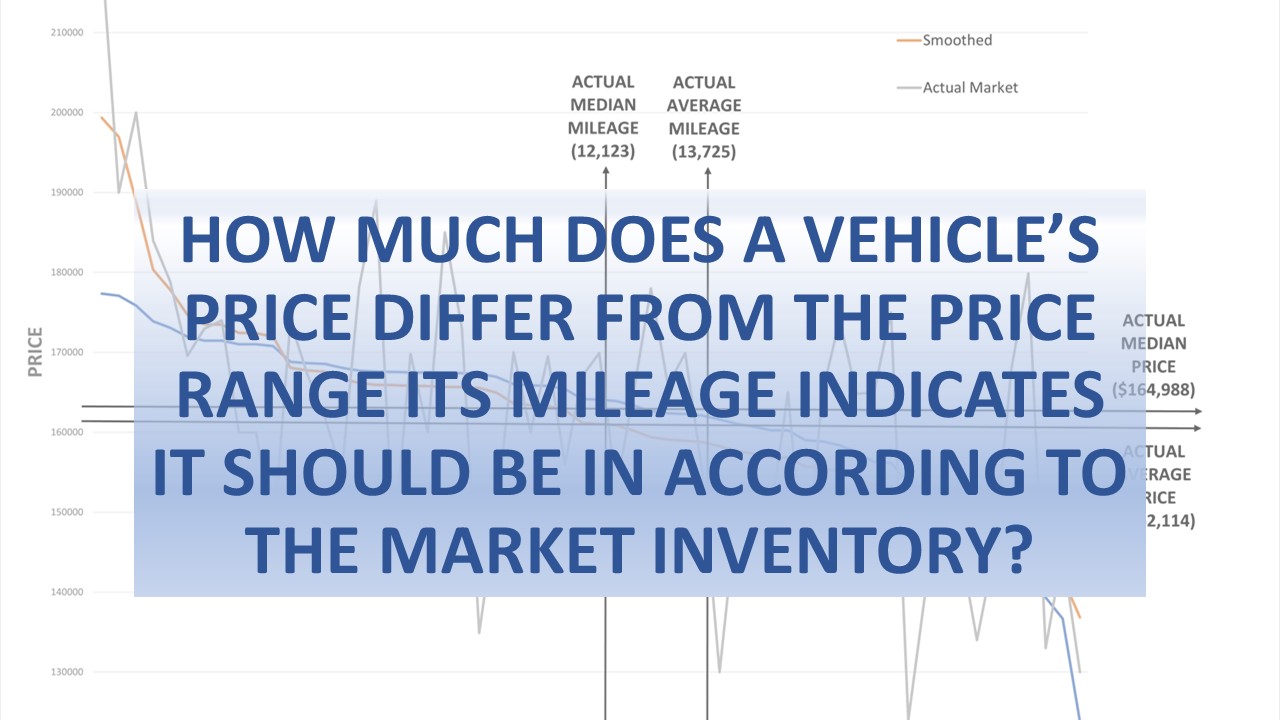
The Sage Rank app uses Sage Range system median analytics to compare a vehicle’s stated price and actual mileage match up to the market inventory’s interpretation of price at that mileage. Given a stated price, it determines how far off the vehicle’s price range is from the price range that it is expected to be in at its mileage, in order to be in line with the market inventory. And it assigns a rank based upon how far off the vehicle’s price is from those market expectations.
- The Sage Rank app uses advanced logic to grade and interpret where a vehicle’s price and mileage combination place it in the current market inventory and how in or out of line a vehicle’s combination of price and mileage are.
- To do this it extrapolates the ranges for the submitted price and mileage and combines them in ‘ranking’ terms as to how closely the vehicle fits in the current market inventory against market expectations of price given mileage.
- In statistical terms, the Sage Rank indicates how distant a vehicle’s price and mileage are from expected values measured against the market inventory distribution of vehicle’s price and mileage ranges.
- Included with Premium, Premium Plus and Premium Pro Subscription.
Sage Range App
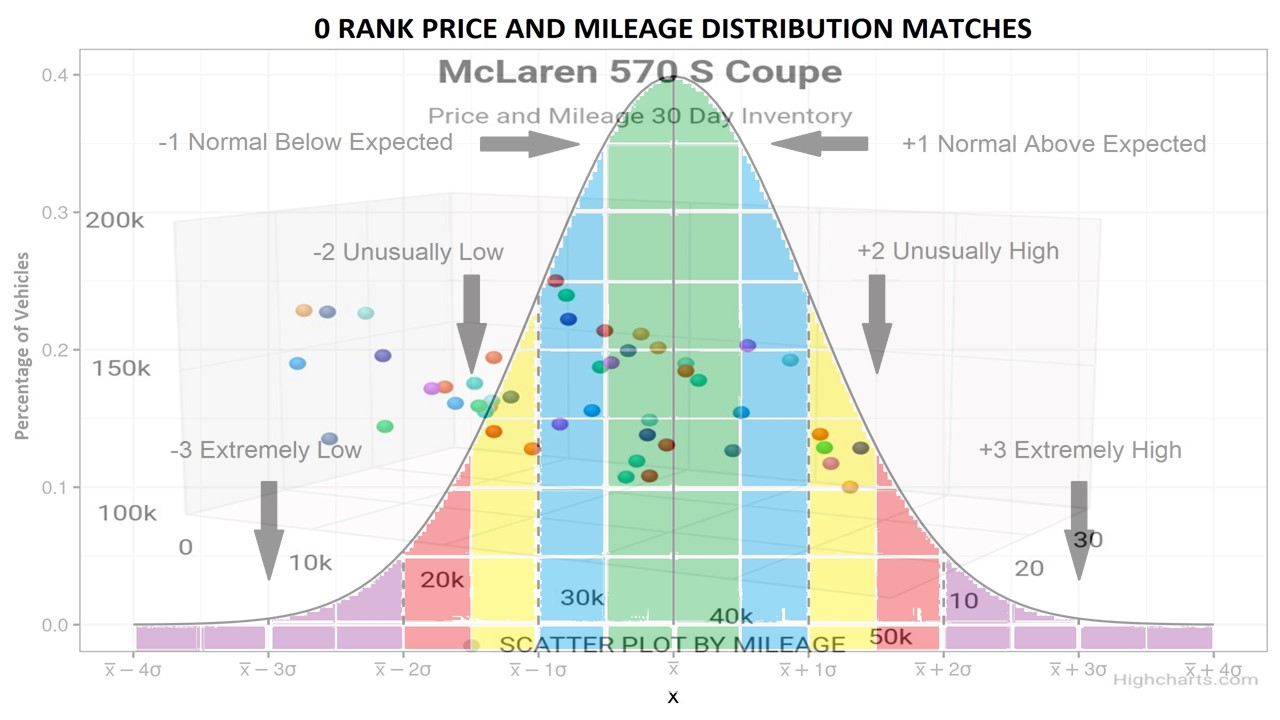
- The Sage Range app analyzes the current market inventory for the submitted vehicle model, creates statistical distribution models for price and mileage and then divides the distributions into price and mileage ranges.
- It then defines and interprets these ranges in terms of the market distribution.
- This allows you to understand where a specific vehicle fits into the market inventory in terms of price and mileage using the distribution of actual market values.
- And to evaluate whether a vehicle’s price or mileage are normal, unusual or extreme compared to the market.
- Included with Premium, Premium Plus and Premium Pro Subscription.
Rank And Range Apps A La Carte
Sage Price App A La Carte
Sage Revaluation App A La Carte
Sage Apps A La Carte Suite
Deep Market Analytics


Sage REVALUATION App
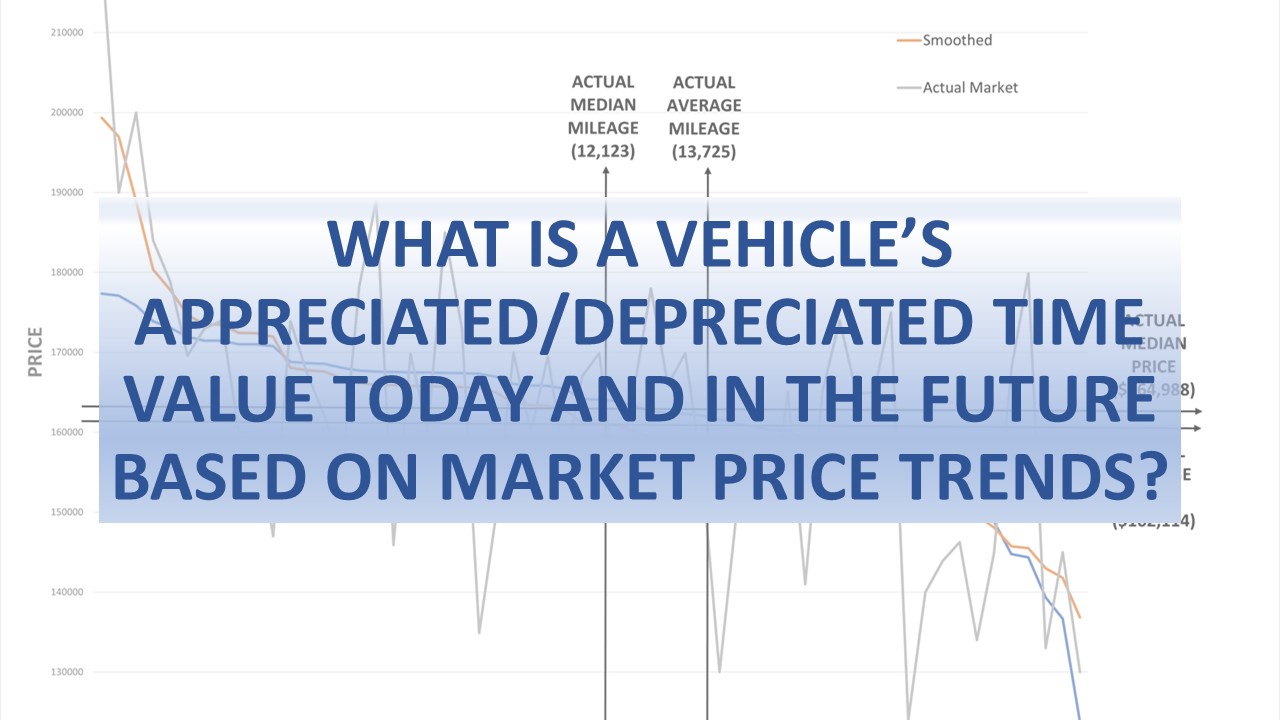
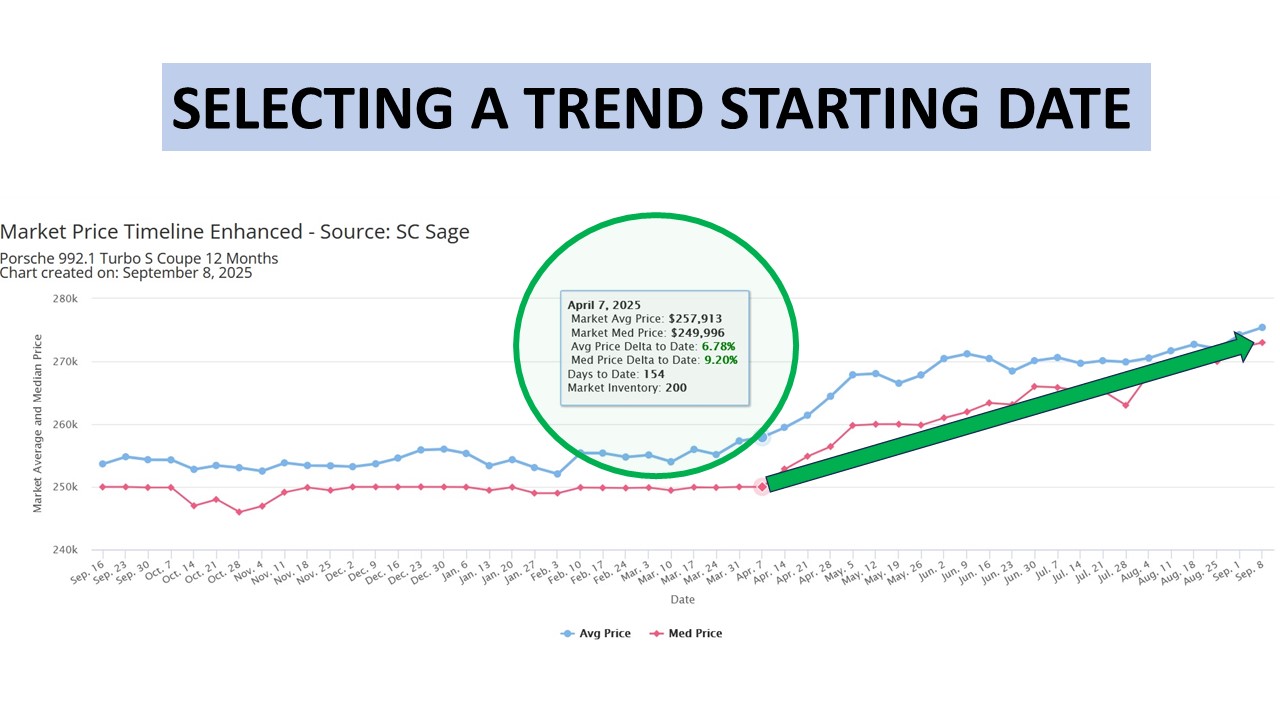
Similar in concept to calculating the present values of financial assets using interest rates, the app uses the market median price rate of change to assess the present value of a vehicle. To do this the app appreciates or depreciates a vehicle from a given price by applying a price trend to a stated price at the start of the submitted holding period. It also forecasts the price of vehicle at a future point in time using the same price trend rate of change. The app can also display the vehicle’s median price and mileage at any historical date.
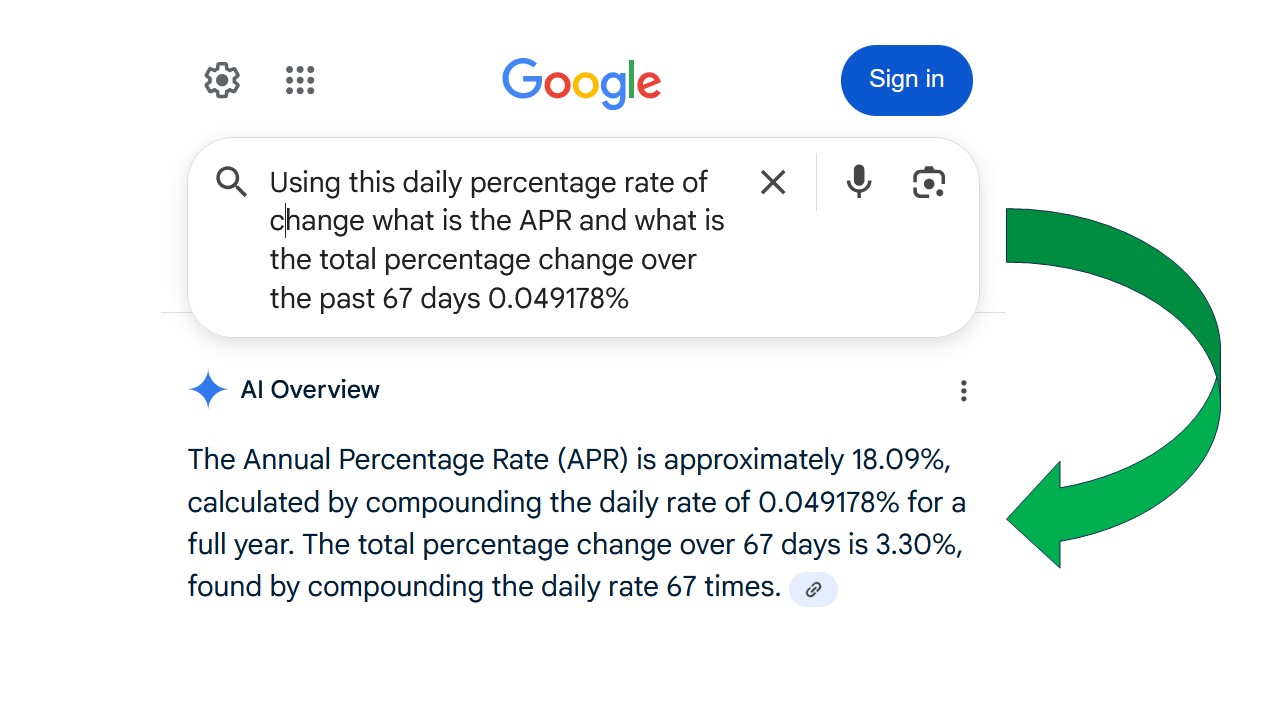
- The Sage Revaluation app calculates the daily rate of change over the trend period. It then applies that rate of change to the price at the start of the holding period to estimate the price today.
- It uses the model’s estimate of today’s price to extrapolate the future value using the same trend rate of change.
- A shift in medians represents a shift in the entire market as a whole. Not just a change in a few high or low priced or mileage vehicles which can strongly influence biased measurements like averages.
- Because the trend is based upon the change in market median price the trend rate of change applies equally to retail and wholesale pricing.
- Included with Premium Plus and Premium Pro Subscription.
Market Value App
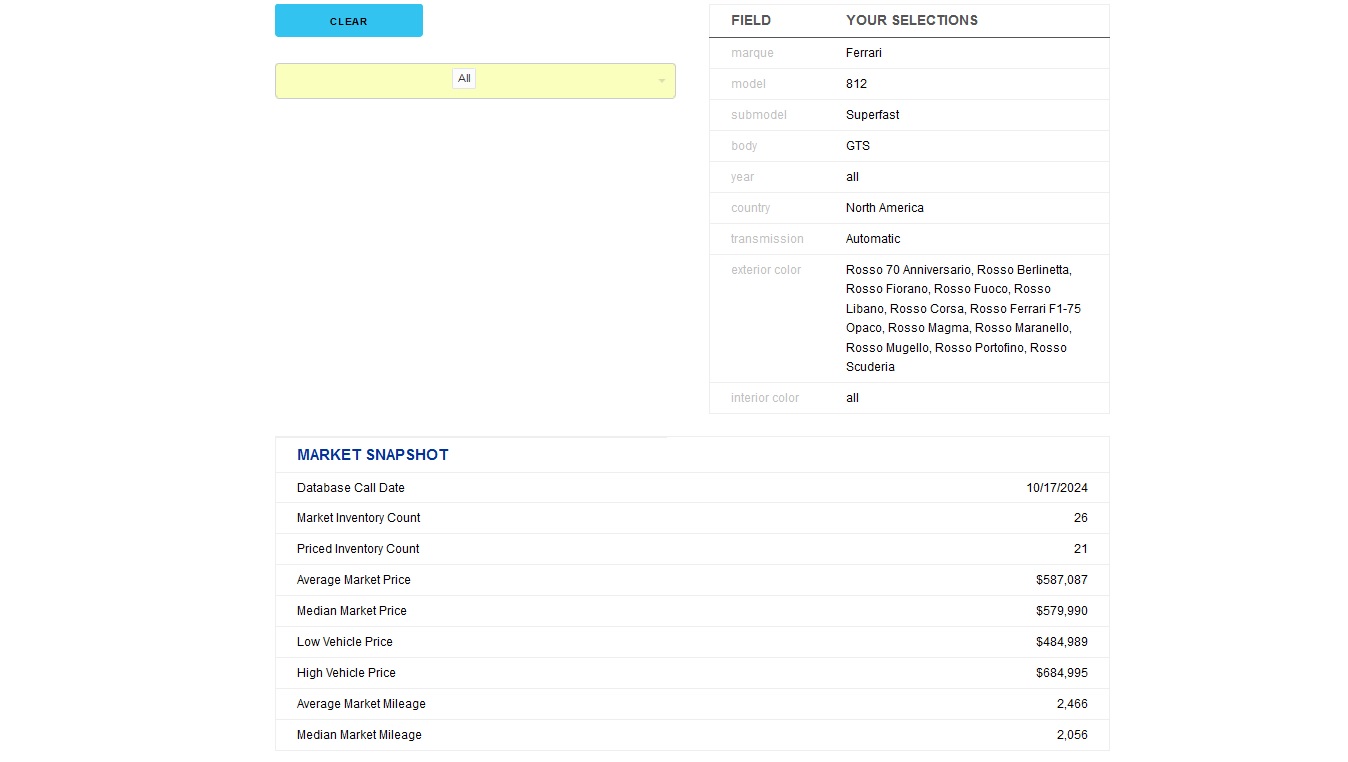
- The app pulls the market inventory matching the submitted spec and segregates inventory which is priced with mileage from inventory which is missing this data.
- Using the filtered data it calculates price and mileage stats and displays the results.
- The data and analytics are updated daily to reflect the changes in the market inventory.
- Included with Premium, Premium Plus and Premium Pro Subscription.
Valuation Kit App
- The app prefilters market inventory matching the submitted spec for those with price with mileage.
- Using the filtered data it calculates price and mileage stats and compares them to the values submitted for the vehicle.
- The data and analytics are updated daily to reflect the changes in the market inventory.
- Included with Premium Plus and Premium Pro Subscription.
Rank And Range Apps A La Carte
Sage Price App A La Carte
Sage Revaluation App A La Carte
Sage Apps A La Carte Suite
Vehicle Assets By VIN
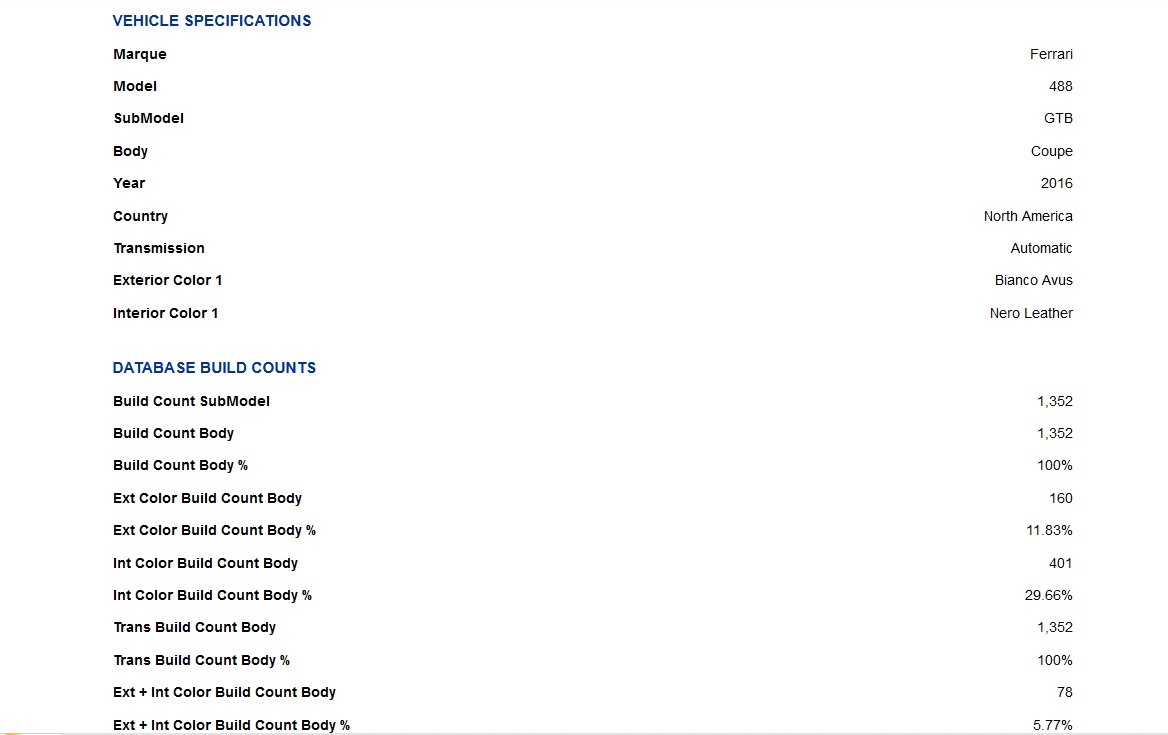
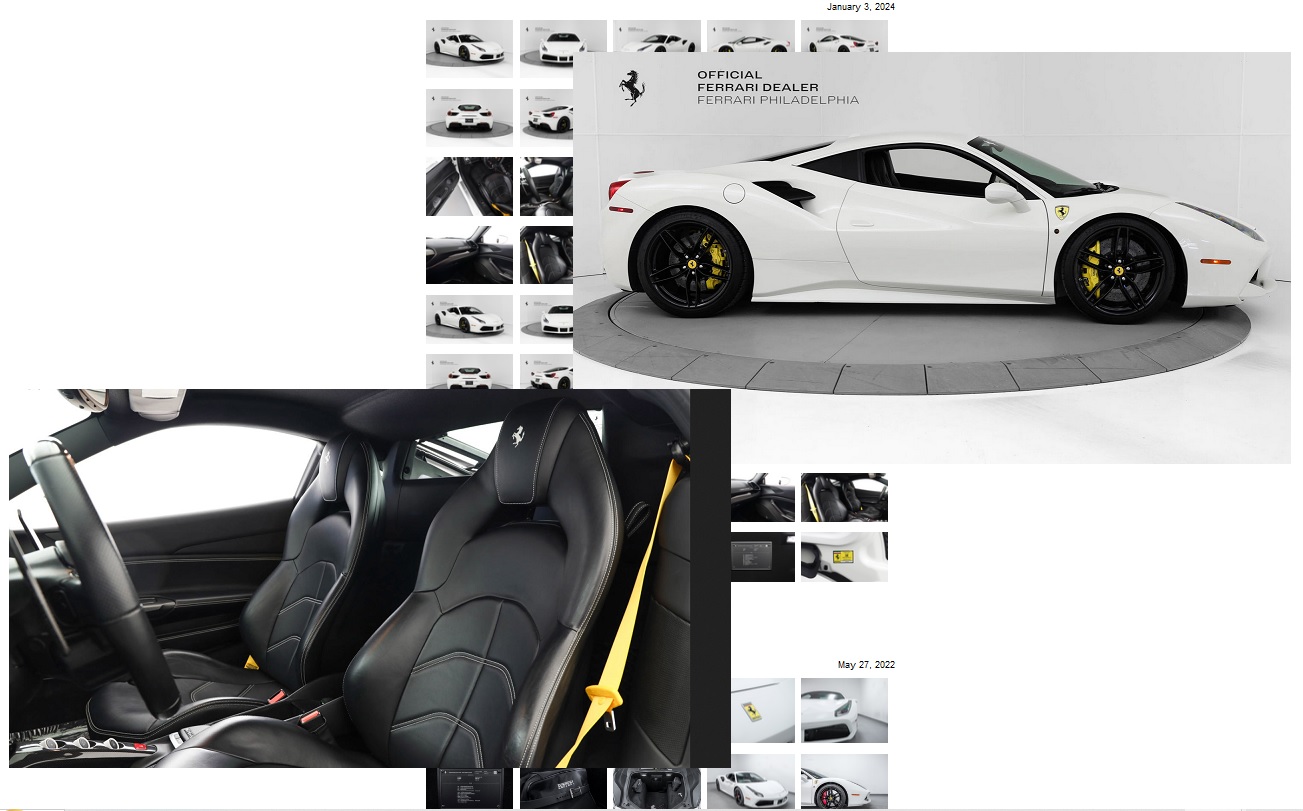
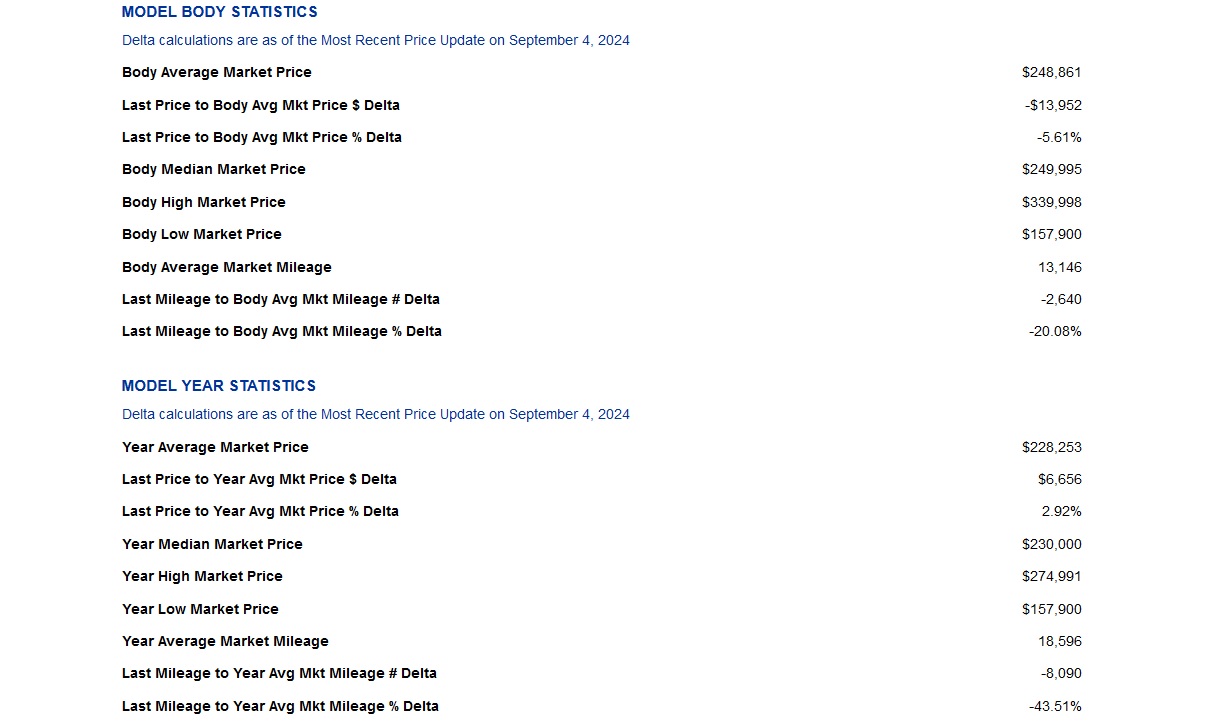
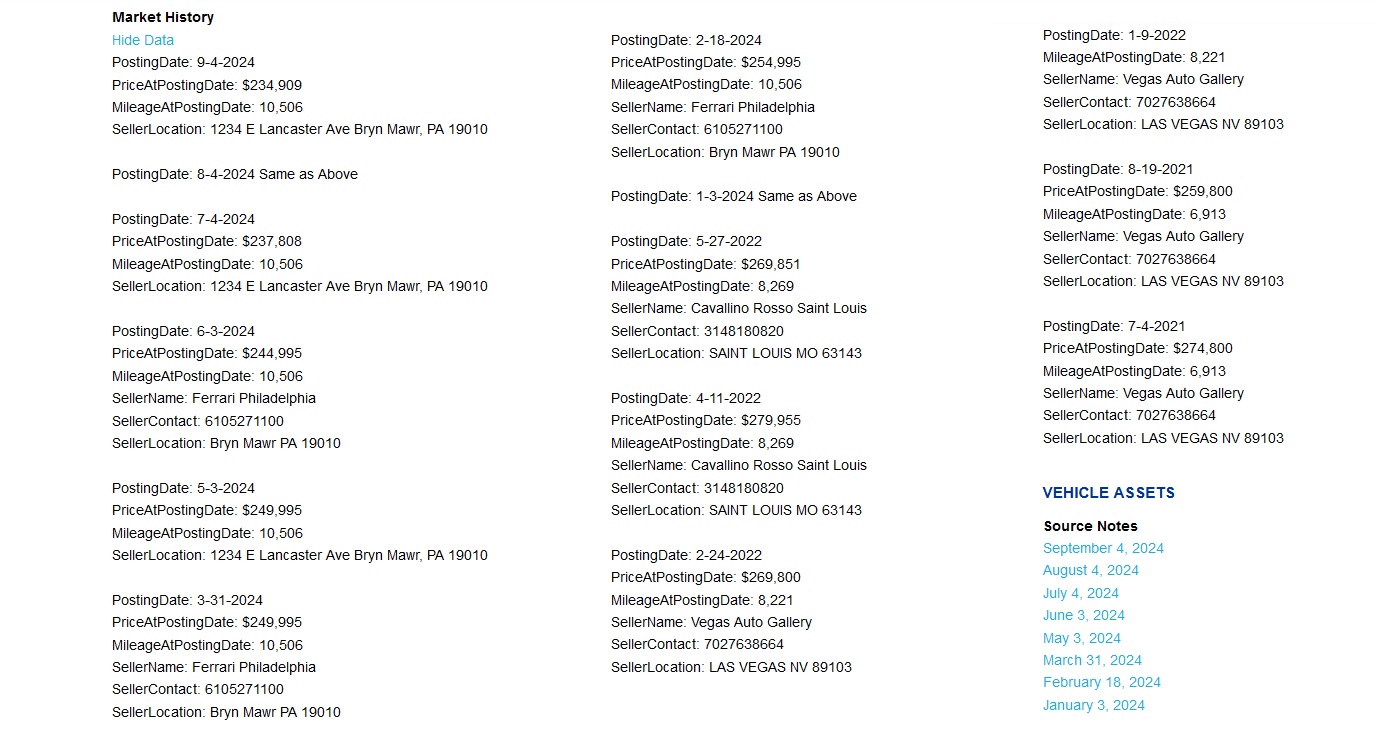
Vehicle Page App
- Assess the relative rarity of the build spec starting with the number of vehicles built for the North American market all the way down to the number built in the color combination. Build counts include by body type and transmission type (if applicable).
- Learn the most recent market price of a vehicle recorded by SC Sage and the number of current comps on the market by body type and model year.
- Compare the last price and mileage to the market average and median overall or by model year.
- Review available ‘on the market’ history of a vehicle to understand where it has been sold, how it has been traded and how its asking price has changed over time.
- Review seller source notes collected at observation points over time.
- View, download or share historical images of a vehicle collected at observation points over time.
- Included with Premium, Premium Plus and Premium Pro Subscription.
Rank And Range Apps A La Carte
Sage Price App A La Carte
Sage Revaluation App A La Carte
Sage Apps A La Carte Suite
Historical / Market Charts
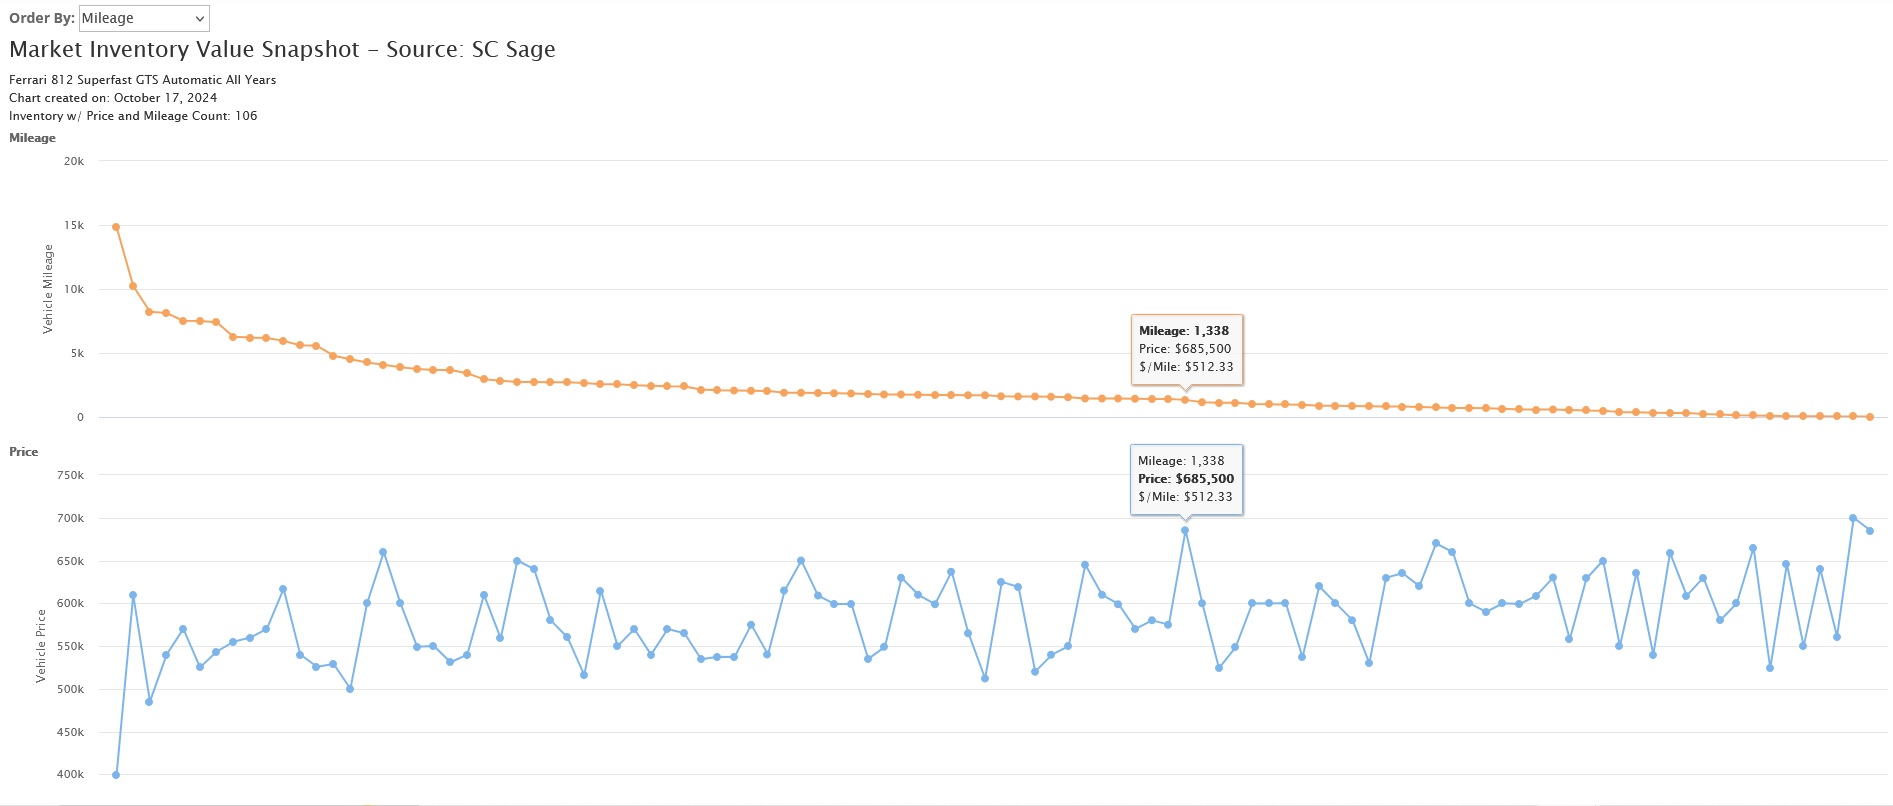
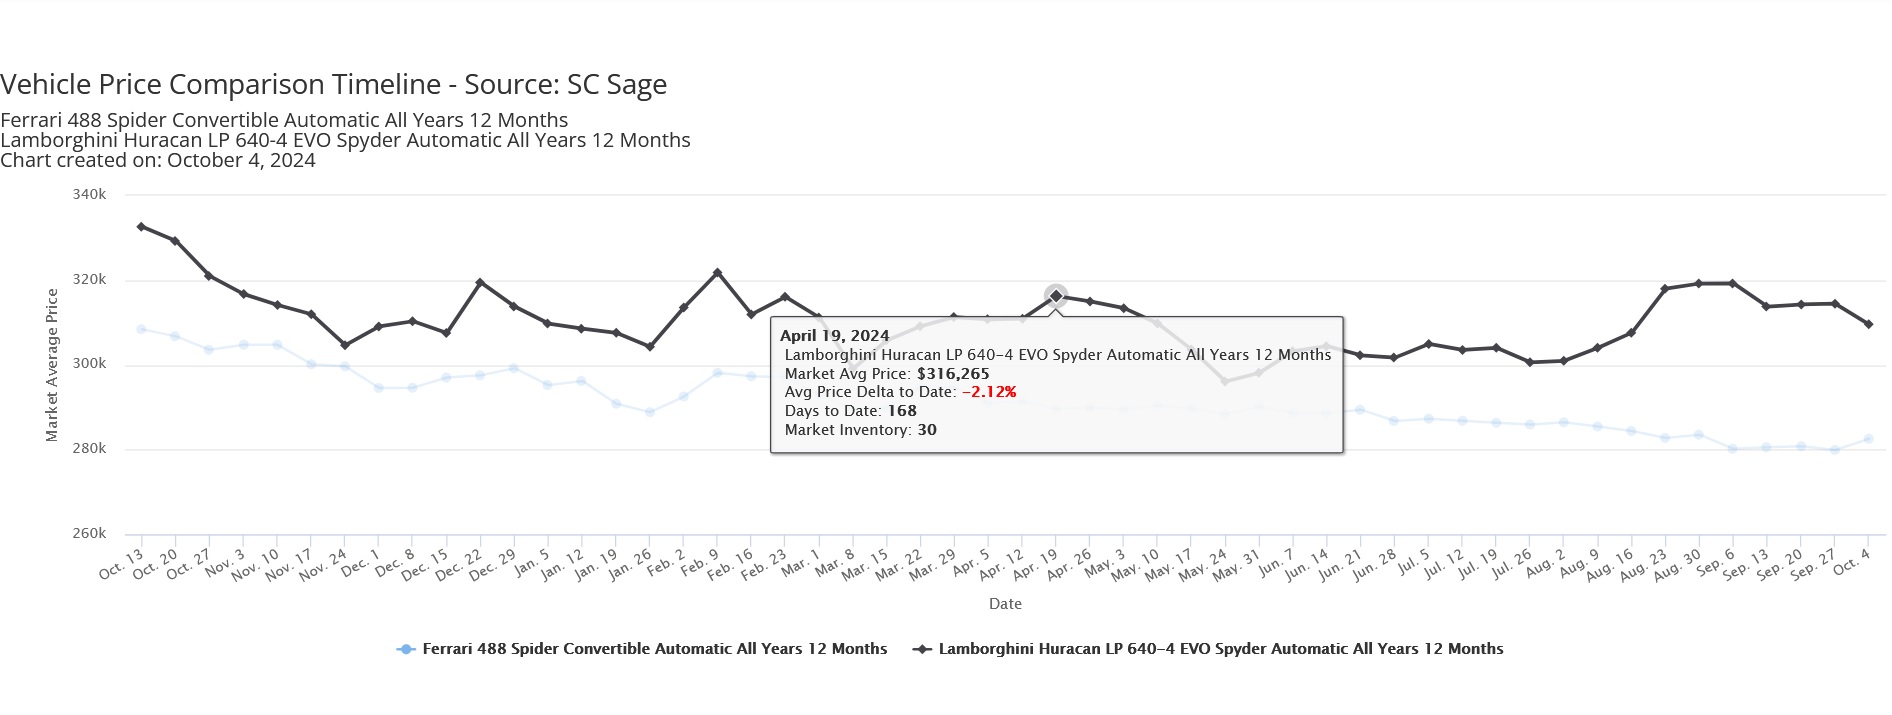
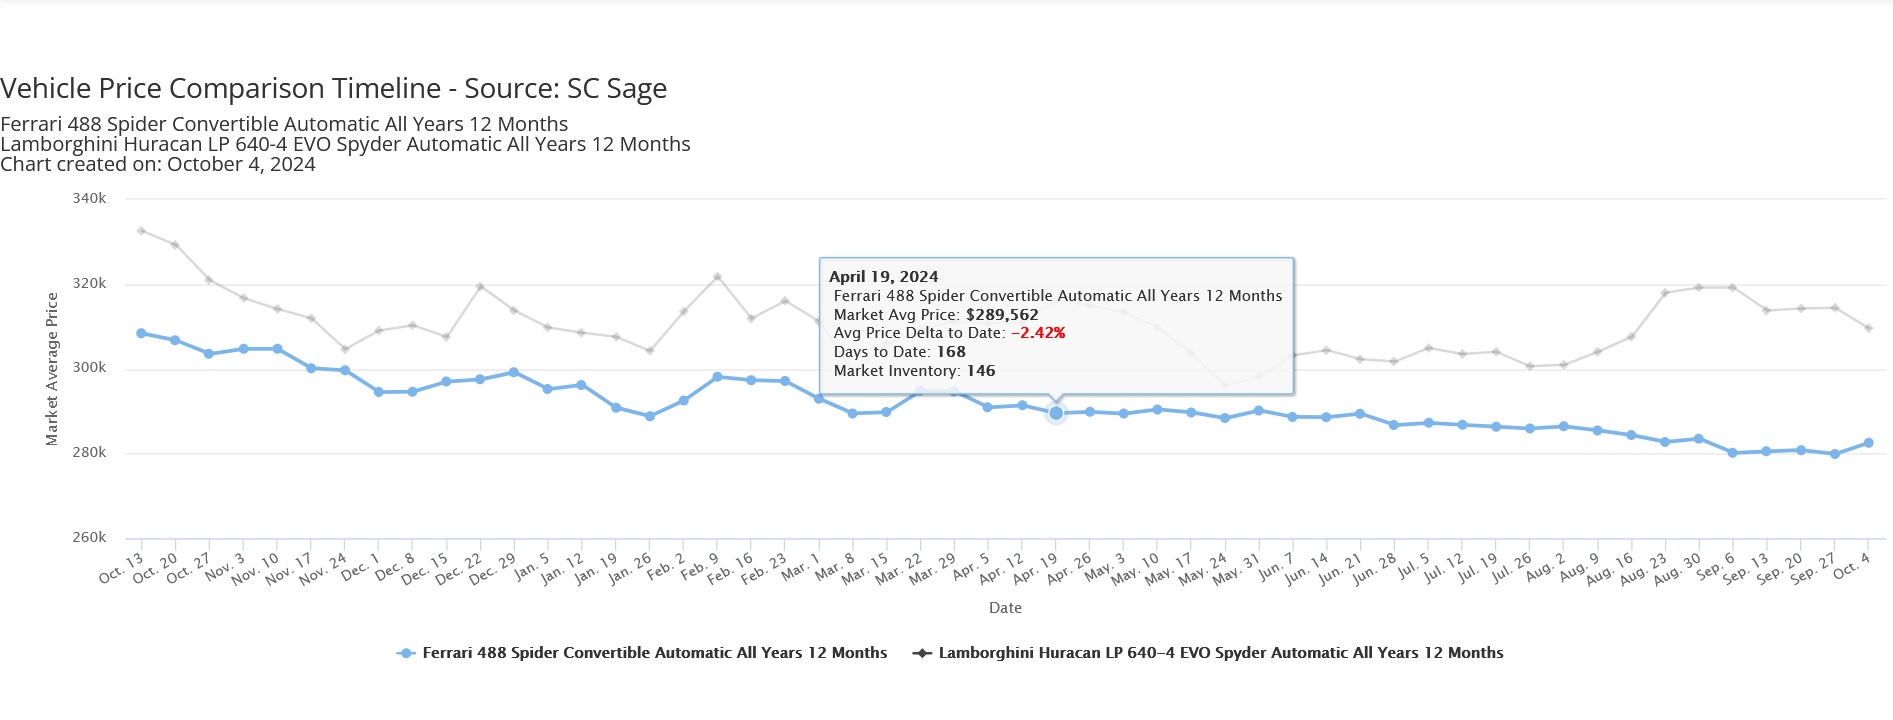

Market Inventory Snapshot Chart
Understand the landscape of the current market inventory for over 150 Ferrari, Lamborghini, McLaren and Porsche models in the SC Sage database. Vector mileage, price or $/mile to identify where any vehicle fits into the current market. From this unique and proprietary chart with one click you can view the matching Market Inventory app or any specific VIN in the Vehicle Page app. The chart’s source data is updated daily.
- The Sage Range app analyzes the current market inventory for the submitted vehicle model, creates statistical distribution models for price and mileage and then divides the distributions into price and mileage ranges.
- It then defines and interprets these ranges in terms of the market distribution.
- This allows you to understand where a specific vehicle fits into the market inventory in terms of price and mileage using the distribution of actual market values.
- And to evaluate whether a vehicle’s price or mileage are normal, unusual or extreme compared to the market.
- Included with Premium Plus and Premium Pro Subscription.
Enhanced Price Timeline Chart
Get market average and median price trends for over 150 Ferrari, Lamborghini, McLaren and Porsche models in the SC Sage database with this enhanced price trend chart. There is no other price trend chart from any source which is as statistically robust and as current with source data updated daily.
- The Sage Price app uses median mileage metrics to in two distinct pricing models to determine the ‘pure mileage’ base value of a vehicle given its mileage.
- The ‘Zero Rank’ model calculates a price using the combined market inventory distribution ranges for price and mileage using ‘Zero Rank’ logic.
- The ‘Linear’ model uses all of the price and mileage pairs in the market inventory to extract a price by applying a ‘best fit’ linear regression model.
- The models extrapolate the unexplained difference between the pure mileage based price and a submitted price.
- Included with Premium, Premium Plus and Premium Pro Subscription.
Vehicle Price Comp TImeline Chart
Compare market price trends for two different marque’s models in the SC Sage database with this dual specification price trend chart, the only one of its kind in the world. There are no other price trend charts from any source which are as statistically robust and as current with source data updated daily.
- The Sage Price app uses median mileage metrics to in two distinct pricing models to determine the ‘pure mileage’ base value of a vehicle given its mileage.
- The ‘Zero Rank’ model calculates a price using the combined market inventory distribution ranges for price and mileage using ‘Zero Rank’ logic.
- The ‘Linear’ model uses all of the price and mileage pairs in the market inventory to extract a price by applying a ‘best fit’ linear regression model.
- The models extrapolate the unexplained difference between the pure mileage based price and a submitted price.
- Included with Premium, Premium Plus and Premium Pro Subscription.
Rank And Range Apps A La Carte
Sage Price App A La Carte
Sage Revaluation App A La Carte
Sage Apps A La Carte Suite
Inventory Data Tracking

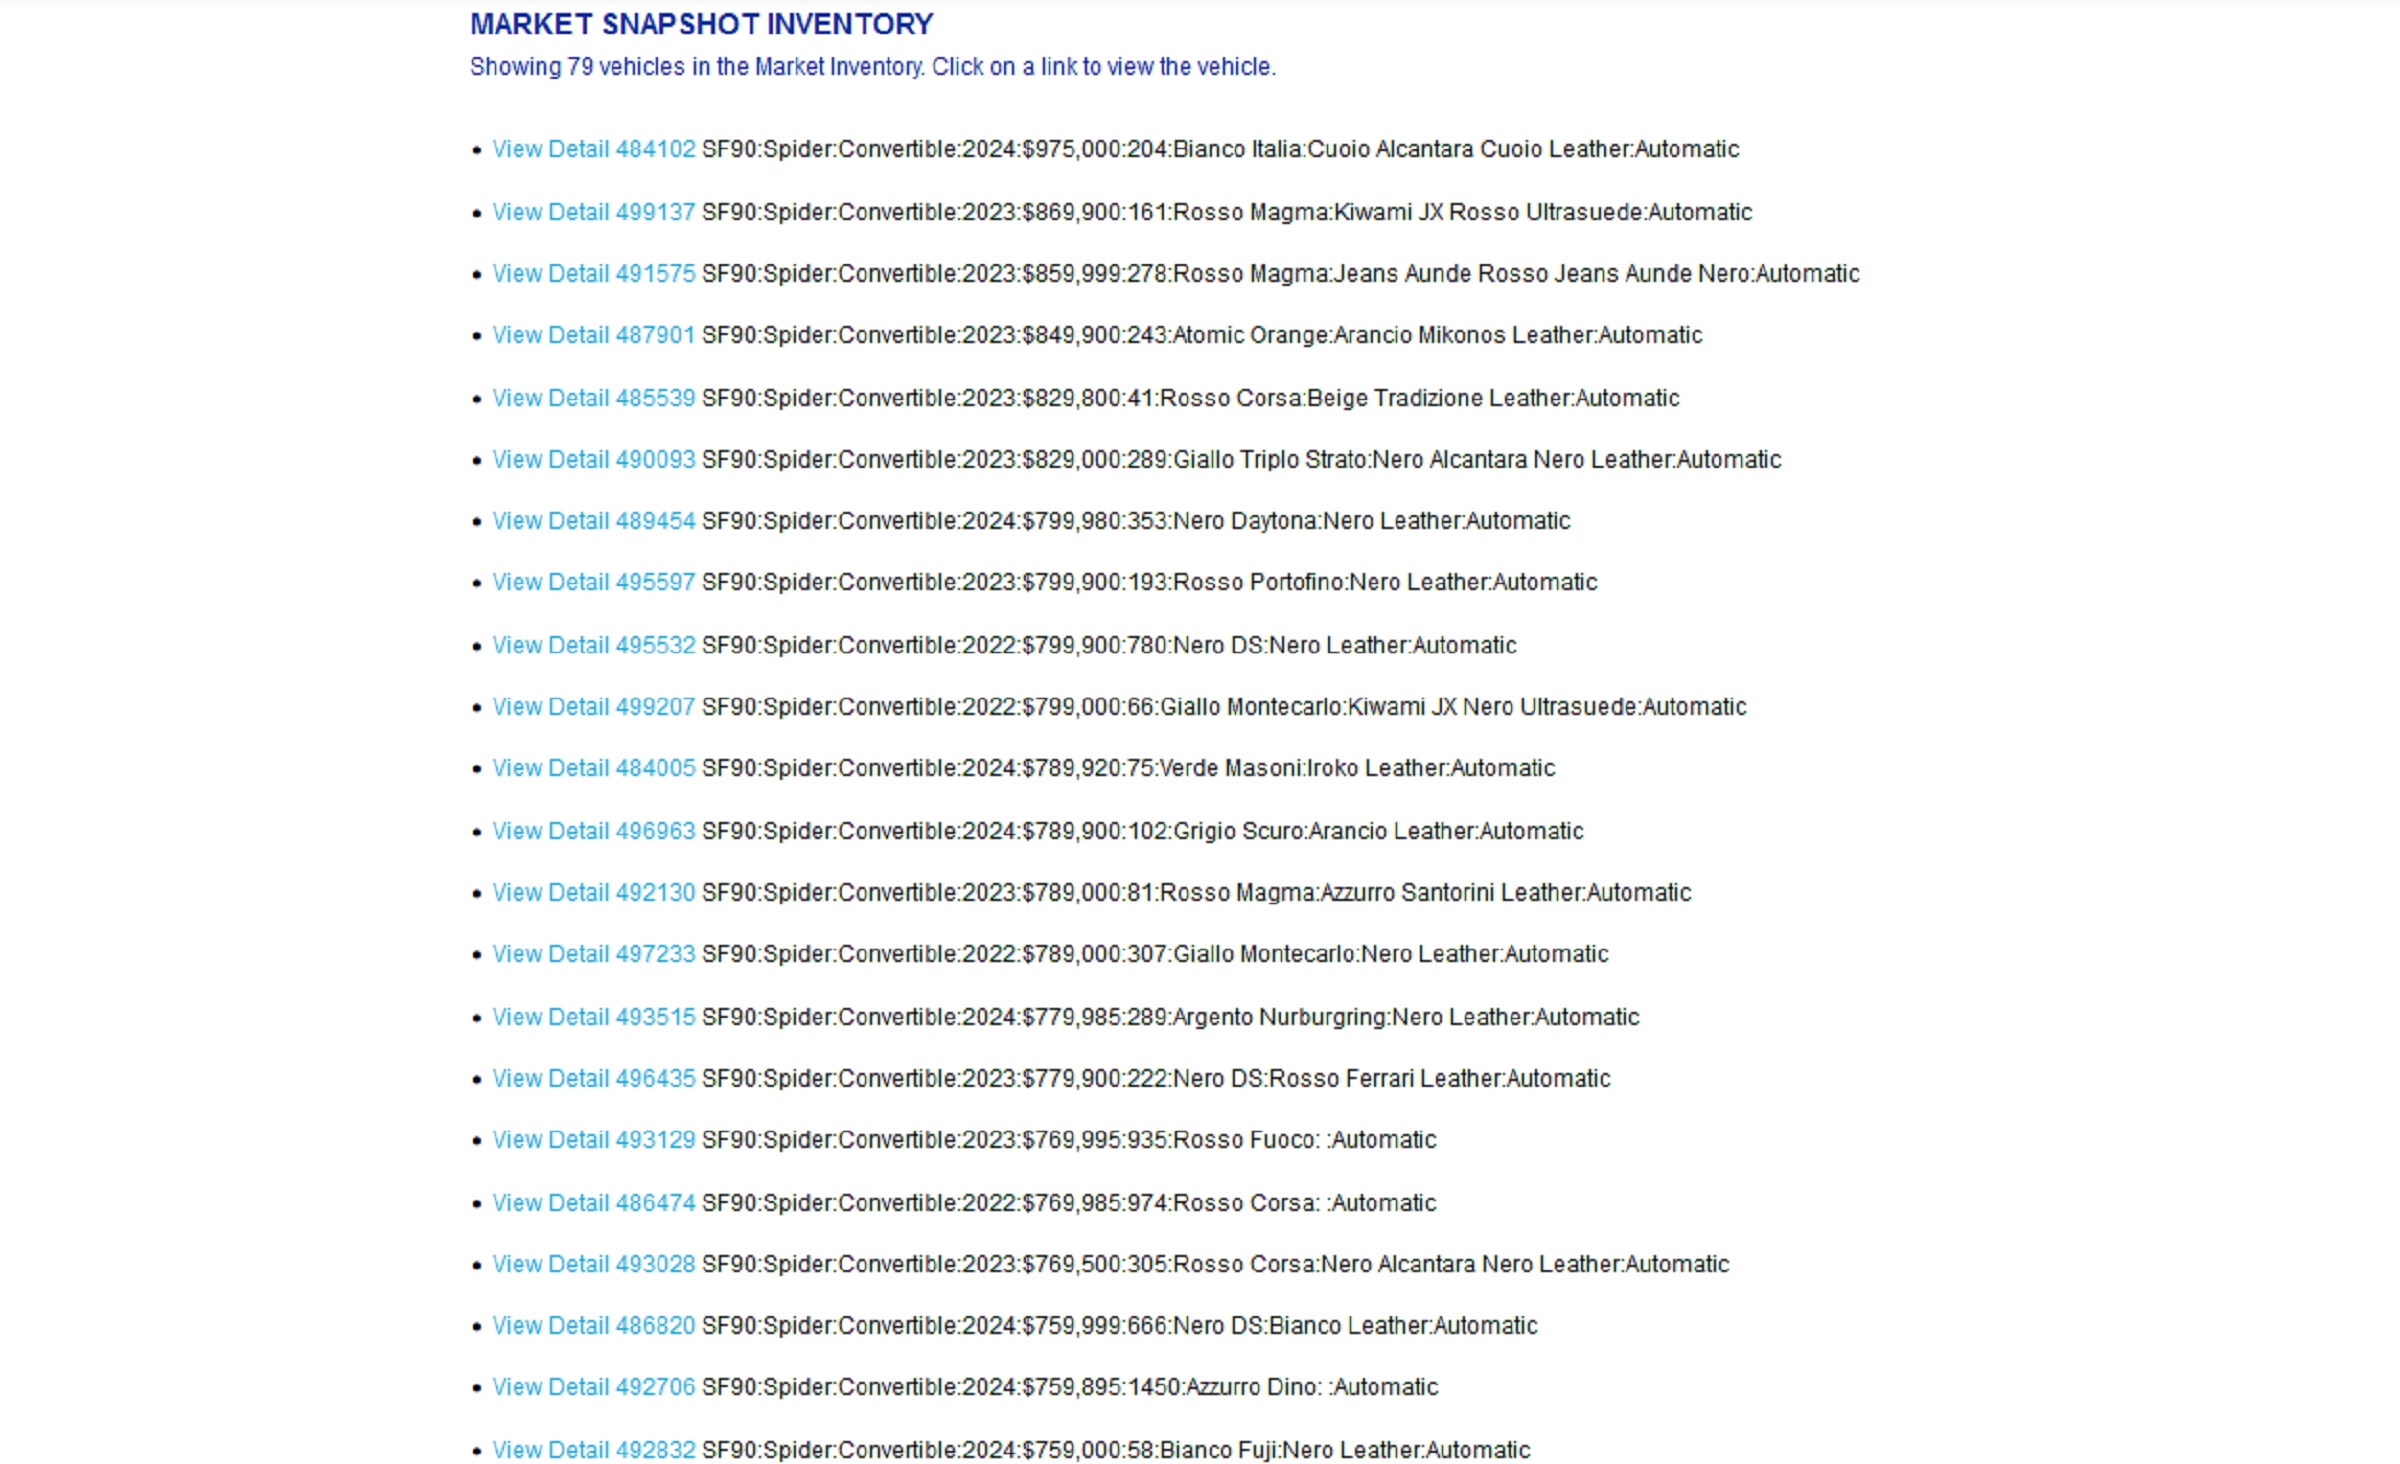
Market Inventory App
The Market Inventory app pulls all, or priced only, market inventory by VIN or by matching a submitted specification. The inventory is listed from highest price to lowest price with each vehicle featuring a one-click link to the Vehicle Page app. It uses the inventory data set to filter in vehicles with price and mileage and it uses this filtered inventory to generate price and mileage stats similar to the Market Value app.
- Using the specification selector generates data and analytics matching the exact specification submitted.
- Each vehicle listing includes year, price, mileage and colors, as available.
- Each vehicle is linked to its Vehicle Page app.
- One-click access to the inventory’s matching Market Inventory Snapshot Chart.
- Included with Premium Plus and Premium Pro Subscription.
BAT 12 PROJECT & AFTER HAMMER REPORTS
“Analysis shows that the comments leading up to the 12 hour window are the most critical, covering 99% of the issues ahead of the hammer.”
“The BAT 12 After Hammer bidding report reveals all the action through the final hammer – including detailed minute by minute bid history charts.”
SC SAGE MARKET VALUE APP SPECIAL ACCESS
Purchase access to our Market Value App data with no limit on the number VINs you can submit in the subscription window. Pull the fully updated market inventory extended stats including market counts, average and median price, average and median mileage and high and low prices. Data and analytics updated daily to reflect the changes in the market inventory.
ROBUST HIGHLY EXTRACTED API ACCESS
Our API suite parallels our Apps and Charts. Available endpoints offer everything from basic market data and vehicle pricing to the extracted statistical components which are the building blocks for the applications themselves. Contact us to discuss how our API fits your use case.
An Endpoint for Every Use Case or Derivative Work
Endpoint Name
- VIN Check
- Vehicle Description
- Market Basic Data
- Market Extended Data
- Market Price Basic Timeline
- Market Advanced Data
- Market Price Enhanced Timeline Dealer
- Market Price Enhanced Timeline Consumer
- LN Mileage Price
- Normal Mileage Price
- Core Mileage Value
- Market Inventory Median Absolute Deviation Price
- Market Inventory Median Absolute Deviation Mileage
- Market Median Distribution Raw Price
- Market Median Distribution Raw Mileage
- Median Absolute Deviation Raw Range Locations Vehicle
- Median Absolute Deviation Raw Price and Miles Rank
- Historical Market Inventory Central Tendency Data
- Historical Market Inventory Central Tendency Period Data
Parallel App/Chart
- VIN Check App
- Vehicle Page App
- Market Check App
- Market Value App
- Basic Price Timeline Chart
- Market Value App
- Enhanced Price Timeline Chart
- Enhanced Price Timeline Chart
- Sage Price App
- Sage Price App
- Sage Price App
- Sage Range App
- Sage Range App
- Sage Range App
- Sage Range App
- Sage Range App
- Sage Rank App
- Sage Time Value App
- Sage Time Value App

